Start a conversation
Connect with business owners and decision-makers through the relationships you already have.
 Explore DREAMS ↗
RENEWALS FOR LIFE × DREAMS
Explore a business built around relationships,
expert support, and the potential for renewal income.
Build today with more than today in mind.
RELATIONSHIPS FIRST. EXPERTISE BEHIND YOU.
Connect business owners with people
who can help. Build your skills
and relationships along the way.
Connect with business owners and decision-makers through the relationships you already have.
Ask good questions. Identify business needs where a specialist may be able to help.
Bring in the appropriate team to evaluate the need and explain available solutions.
Support the relationship and explore eligible renewal-based compensation as clients continue.
02 / A DIFFERENT PERSPECTIVE
A sale can end with a payment.
Or begin a relationship that creates
opportunities for ongoing income.
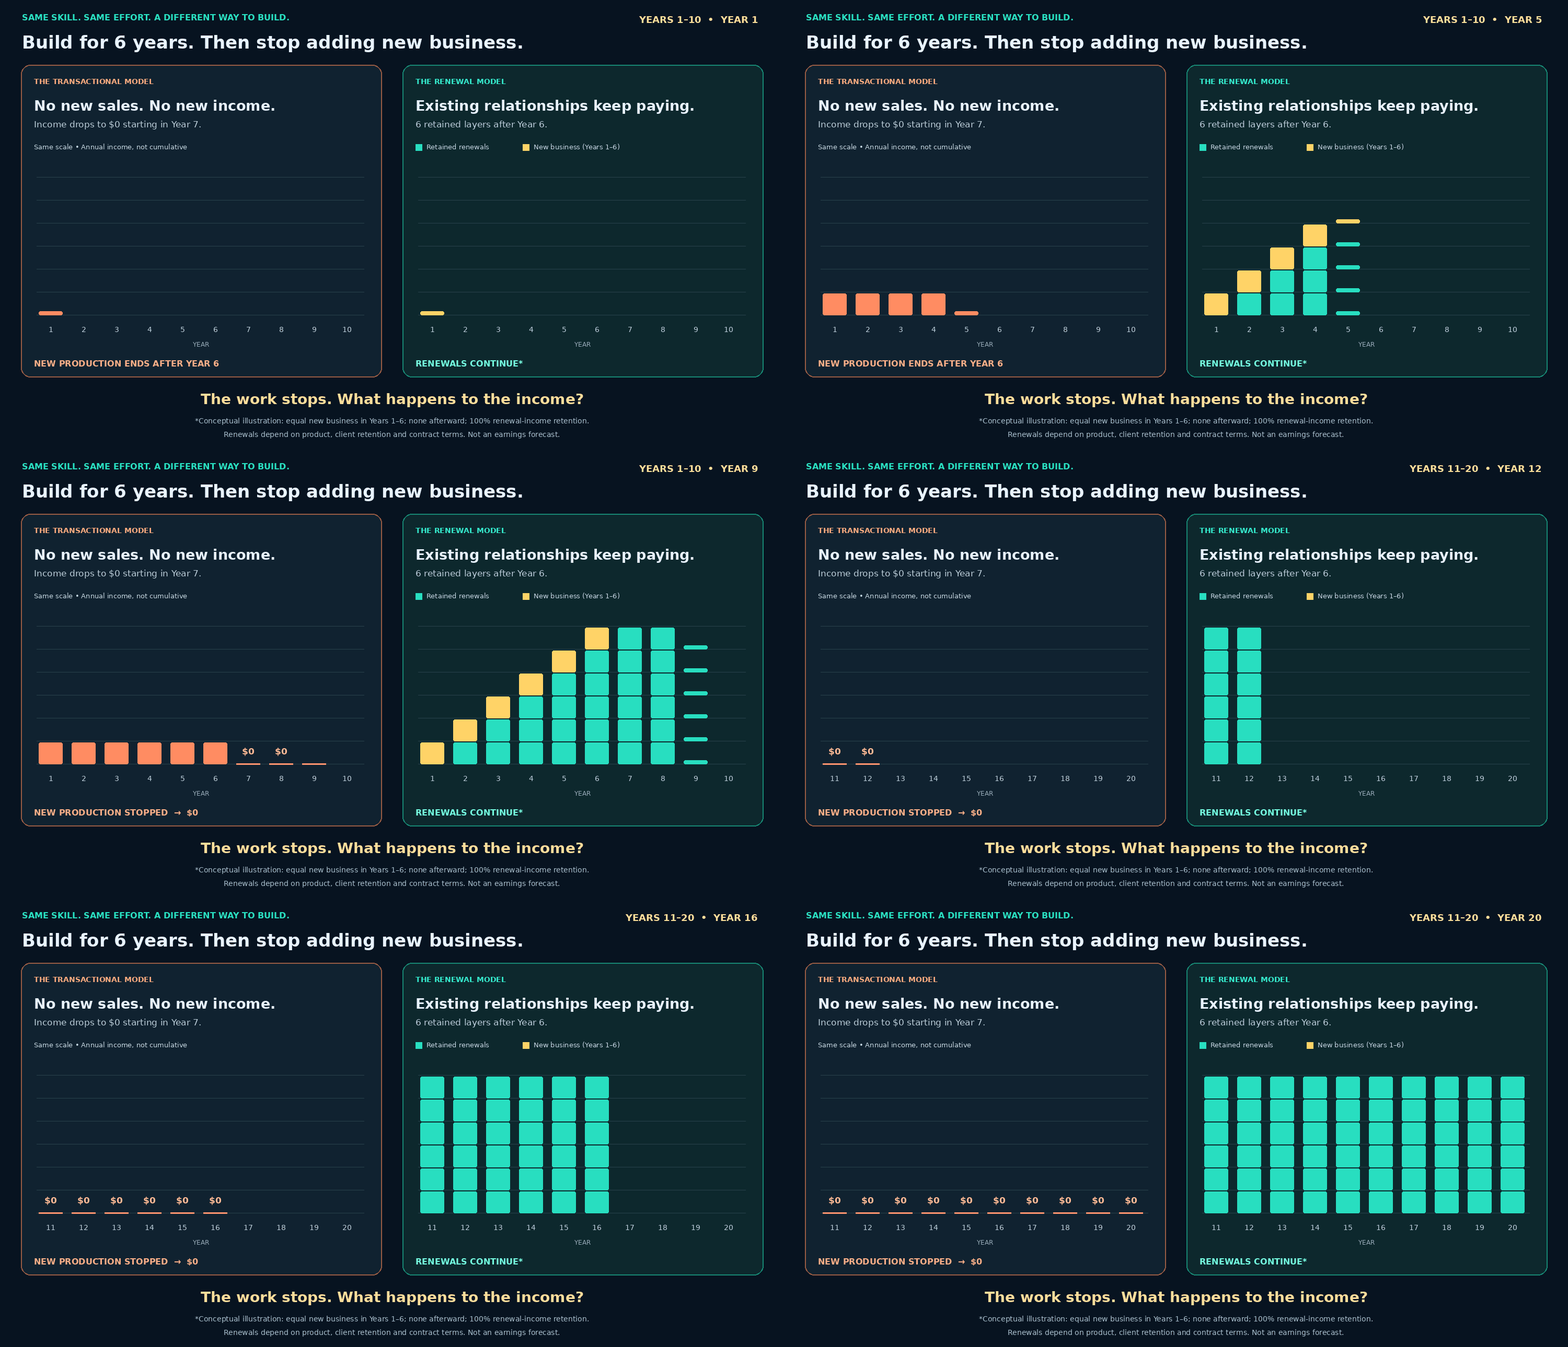
Conceptual illustration: equal new business in Years 1–6, none afterward, and 100% renewal-income retention. Renewals depend on product, client retention, and contract terms. Not an earnings forecast.
03 / YOUR POSSIBILITIES, IN NUMBERS
Move the sliders. Watch the story change.
Same starting income. Two ways to build.
After year 6, the illustration adds no new business. Existing renewal income continues at the selected retention rate.
Swipe the table sideways to see all columns →
| Year | Transactional | Renewal income | Annual difference | Renewal total to date |
|---|
THE DREAMS ADVANTAGE
Connect the income concept with practical tools, training, and expert support.
01 / RELATIONSHIPS
Explore group benefits and other business solutions, including products with ongoing compensation for eligible renewing clients.
Build relationships with lasting value.02 / CAPABILITY
Bring AI tools, organized follow-up, and practical training into your daily workflow. Spend more of your time on meaningful conversations.
More support for the work that matters.03 / PERSPECTIVE
It’s not just how smart you are—it’s how you use your thinking. Expand your perspective, see new possibilities, and use AI to multiply your potential.
Upgrade your thinking. Multiply it with AI.Relationships. Intelligence. Perspective.
Explore your DREAMS partnership ↗CLEAR ASSUMPTIONS. BETTER CONVERSATIONS.
These tools compare income structures.
They do not predict your earnings.
Both models add the same amount of new-business income in each active year. The transactional model pays once for that year’s production. The renewal illustration also retains eligible income from prior years.
The animation stops new production after Year 6. The transactional illustration then falls to zero, while renewal income continues at the illustrated retention rate. The calculator lets you choose the active production period.
The animation assumes 100% annual renewal-income retention. In the calculator, you can lower retention to explore a decline. Actual payments depend on client retention, product terms, contract activity, compensation schedules, eligibility, and performance.
No. The figures are illustrative gross income before expenses, lead costs, taxes, chargebacks, inflation, and business overhead. They are not typical results, an earnings forecast, or a guarantee.
A DIFFERENT PERSPECTIVE


Swipe to explore · Tap enlarge for a closer look